


When I first started working as a respiratory therapist in Florida, thermodilution cardiac output was a lot more hands-on than it is today. We kept the injectate in an ice bath, manually injected it, and entered the results into a handheld computer. Almost nothing was automated. I took a real liking to it. Cardiac physiology fascinated me, and because we were doing so much of the process ourselves, it was easier to see how the number was actually calculated. At one point, I even found a calculation error in one of our Hewlett-Packard monitors, and HP had to change their calculation in their software.
That experience left me with something I still think about: the cardiac output on the screen is not a direct measurement. It’s a calculation, built on the assumption that a known amount of cold saline follows one predictable path through the heart.
VV ECMO breaks that assumption. I didn’t fully appreciate how badly until I went looking for the actual data.
What the number assumes
A Swan-Ganz catheter sits with its tip in the pulmonary artery, and near that tip is a thermistor. To measure cardiac output, you inject a known volume of cold saline into a port that opens in the right atrium. The bolus mixes with venous blood, crosses the tricuspid valve, passes through the right ventricle, and reaches the thermistor. The monitor tracks how far the temperature drops and how long it takes to recover, and from that curve it calculates flow. Low output, big prolonged dip. High output, small, brief dip.
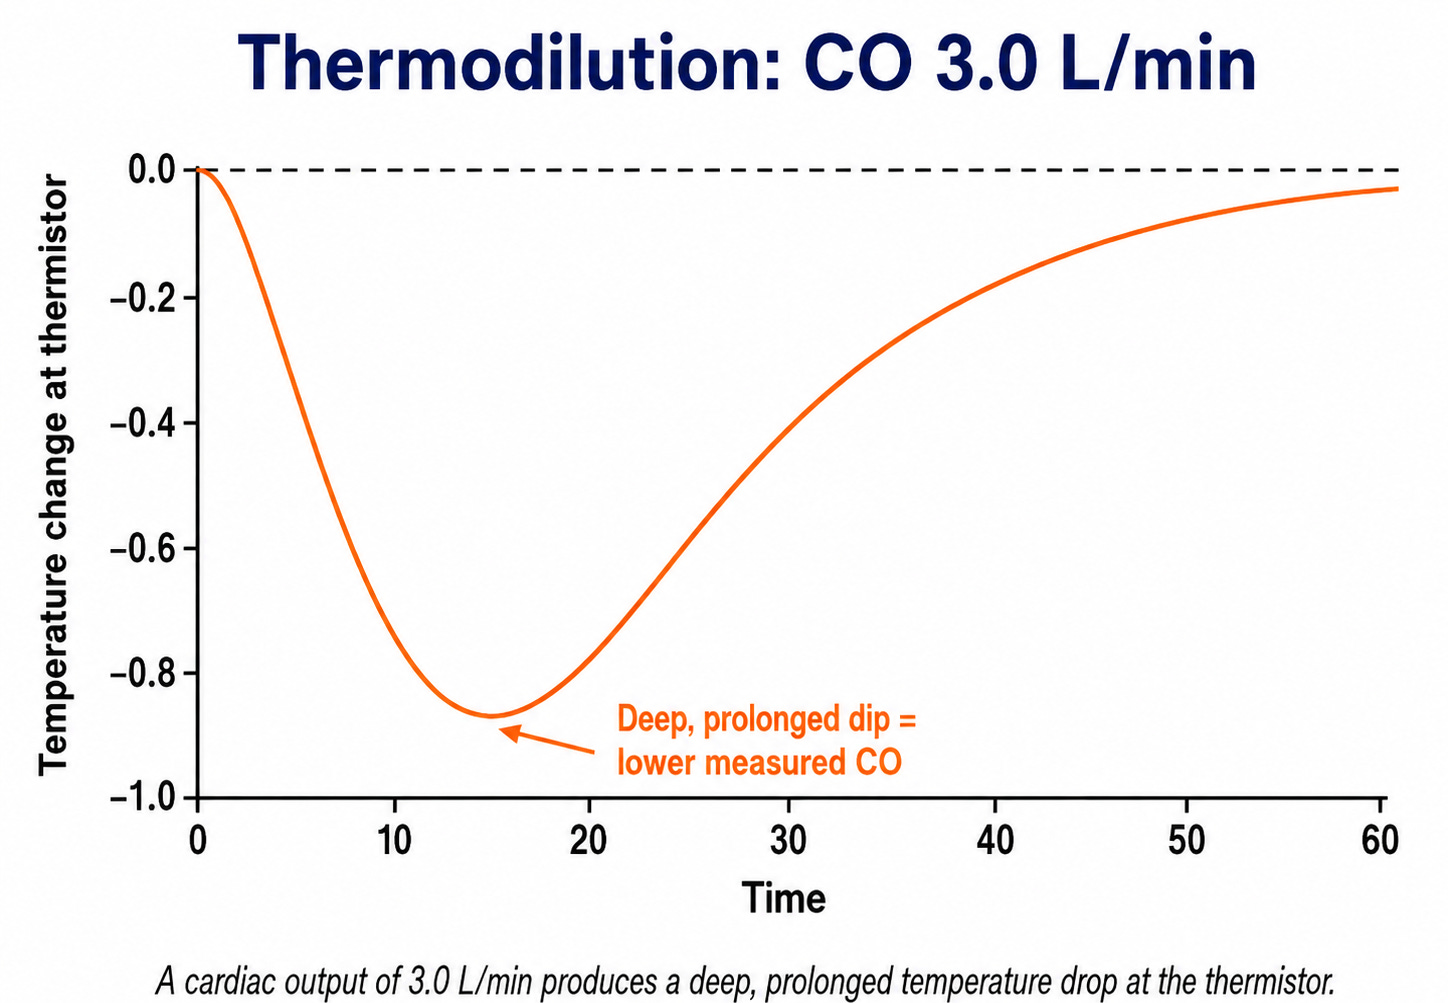
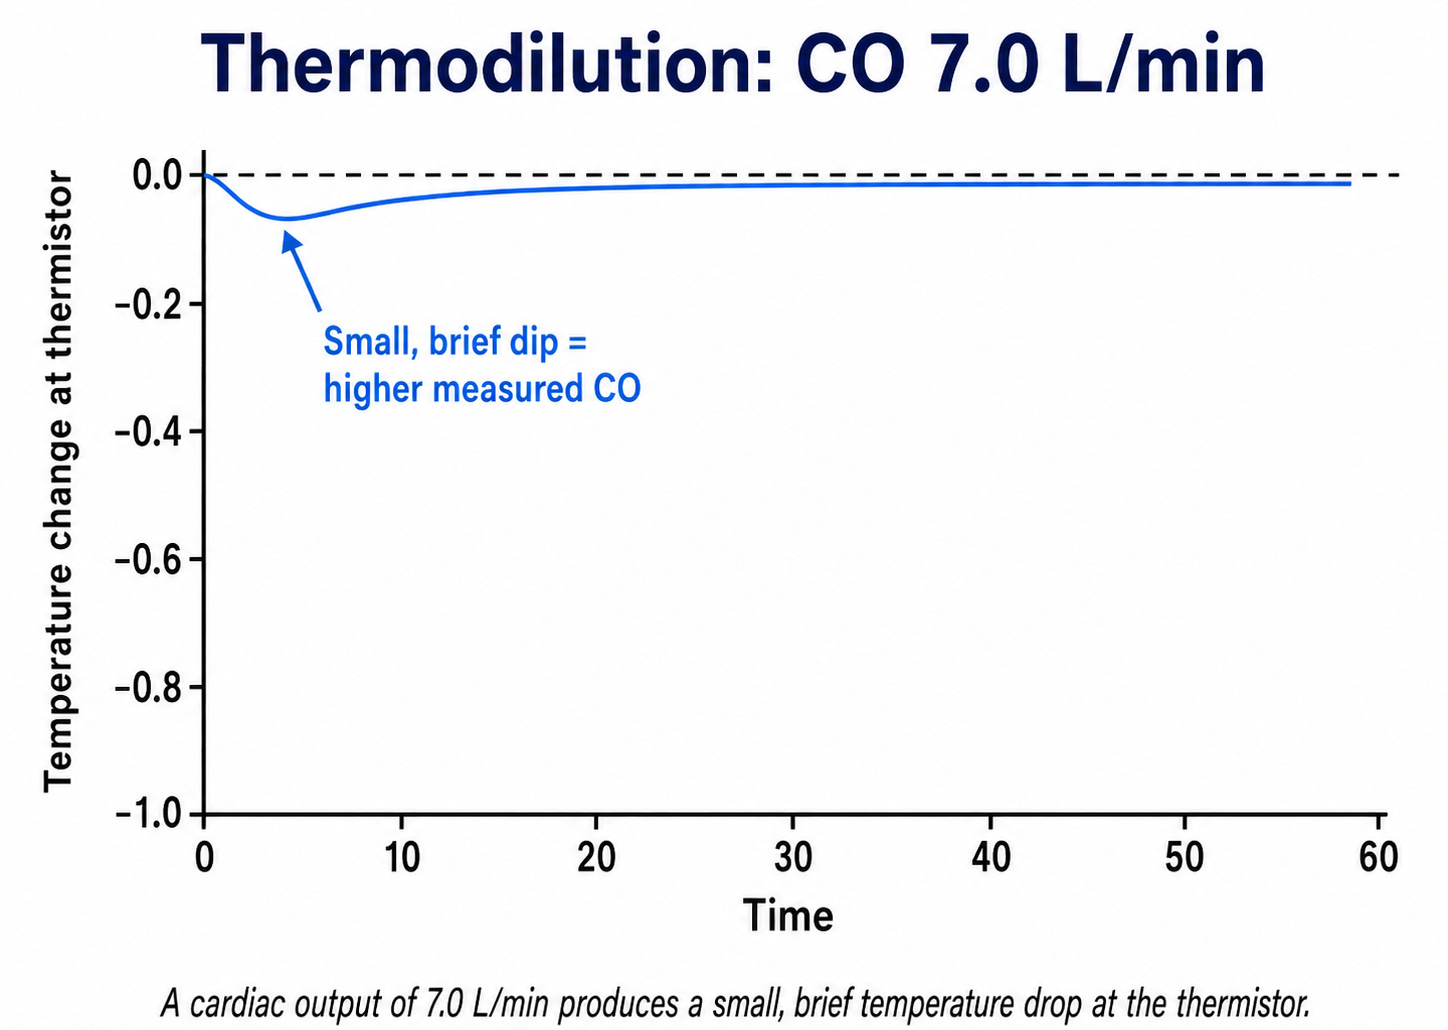
Something in the middle, like a CO of 5.0, lands where you'd expect, a moderate dip between the two.
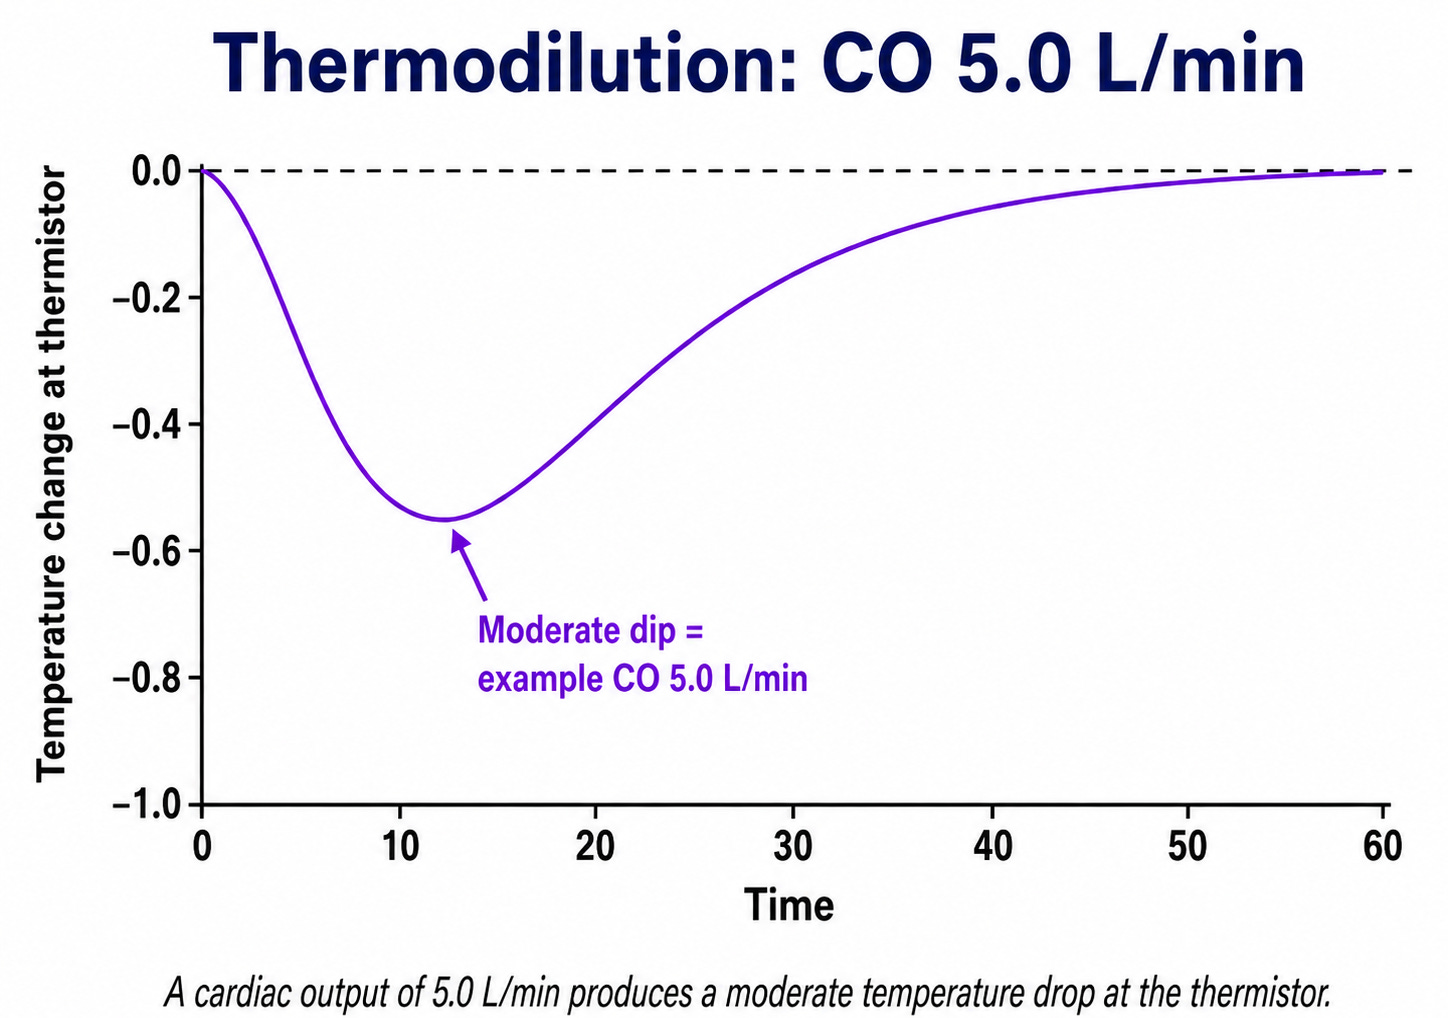
The whole calculation depends on one thing holding true underneath all of it: that essentially all of the cold bolus you injected actually reaches that thermistor.
On VV ECMO, it doesn’t.
Where the bolus goes instead
A VV drainage cannula is placed in the SVC, IVC, or right atrium. That drainage cannula doesn’t know the difference between venous blood and a cold saline bolus you just injected nearby. Some of that bolus gets pulled into the circuit before it ever reaches the tricuspid valve.
Less cold indicator reaching the thermistor means a smaller curve. A smaller curve reads as higher flow. The monitor has no way to know part of its signal went missing, so it reports a cardiac output that’s too high, sometimes by a lot.
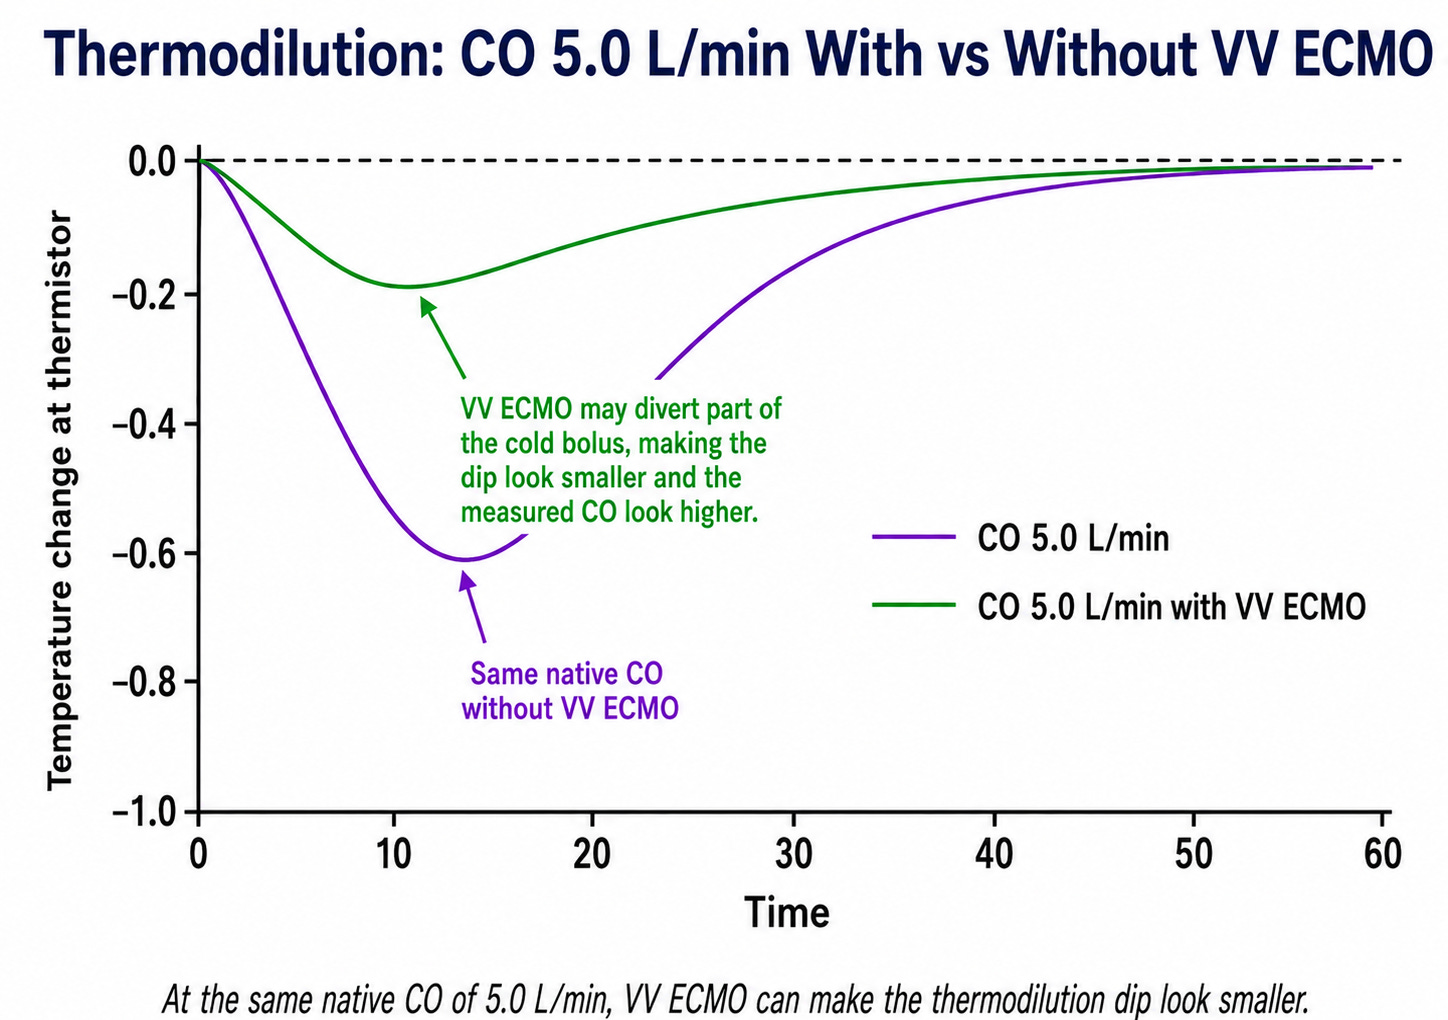
Same patient. Same true cardiac output of 5.0. The only thing that changed between the two curves is whether the circuit was there to steal part of the signal, and that alone is enough to make the number climb.
What’s actually been measured
A 2022 porcine study (Russ et al., ASAIO Journal) put pigs on VV ECMO and compared PAC thermodilution against a true reference flow probe. Thermodilution overestimated cardiac output by a mean of 2.1 L/min in healthy lungs and 2.7 L/min after lung injury, and the error got worse as ECMO flow approached or exceeded native cardiac output.
A 2025 clinical study (Linden et al., ASAIO Journal) compared PAC thermodilution, transpulmonary thermodilution, and 3D echocardiography in 18 real VV ECMO patients. Median cardiac output by echo was 5.2 L/min. Both thermodilution methods read 7.3 L/min in the same patients at the same time.
This isn’t a new finding, either. Back in 1995, Haller and colleagues compared conventional thermodilution against dye injected directly into the pulmonary artery in seven VV ECMO patients, bypassing the circuit entirely. Thermodilution overestimated cardiac output by as much as 300%, up to 10 L/min above the true value, with essentially no correlation to the reference measurement.
Three decades apart, different methods, same direction, same rough magnitude. That’s not noise. That’s a real and fairly consistent bias.
What this means at the bedside
Don’t add ECMO pump flow to a thermodilution number, and don’t trust the absolute value on its own. A cardiac index that looks reassuring on a VV patient could be genuinely reassuring, or it could be a circuit quietly eating part of your bolus. There’s no bedside correction factor, because the size of the error depends on cannula position, ECMO flow relative to native output, and recirculation, none of which you can back out of a single number.
The PAC isn’t useless here. Pulmonary artery pressures, CVP, and SvO2 trends still carry real information, especially if you’re worried about RV failure or pulmonary hypertension. What you shouldn’t lean on is the CO or CI value itself, or anything calculated from it, like SVR or oxygen delivery.
Echocardiography is the more reliable reference for native forward flow on VV ECMO, though it’s worth noting that echo isn’t a perfect gold standard either. LVOT VTI is sensitive to measurement technique and image quality. The honest position isn’t “trust echo instead,” it’s “trust trends across multiple imperfect tools more than one falsely precise number.”
The trend is your friend, if the conditions haven’t changed with it
That old ICU phrase still applies here, but on VV ECMO it comes with a catch. A change in ECMO flow can change how much of your bolus gets captured by the drainage cannula, independent of anything the patient’s heart is actually doing. So can a change in cannula position, or a shift in recirculation. A rising CI could indicate that the heart is working harder. It could also mean the circuit just got a little worse at stealing your indicator.
Next time a thermodilution number moves on one of your VV patients, the question worth asking isn’t just whether it went up or down. It’s whether you can tell the difference between the heart changing and the circuit changing.
If you want more practical ECMO breakdowns like this, subscribe to ECMO 143: Bedside Notes. I also built AI ECMO Educator, a free Custom GPT for ICU clinicians and trainees, physiology, cannulation, anticoagulation, circuit management, and troubleshooting, drawn from ELSO, PubMed, AmSECT, and leading centers.
Disclaimer: educational only; does not replace clinical judgment, institutional protocols, or your ECMO team.